CS1674/2074: Homework 3
Due: 9/27/2023, 11:59pm
This assignment is worth 50 points.
In this problem, you will implement feature extraction using the Harris corner detector, as discussed in class. Use the following signature: function [x, y, scores, Ih, Iv] = extract_keypoints(image)
Input:
- image is a color image of class uint8 which you should convert to grayscale and double in your function.
Outputs:
- Each of x,y is an nx1 vector that denotes the x and y locations, respectively, of each of the n detected keypoints, i.e. points that (1) have "cornerness" R scores greater than a threshold, and (2) who survive the non-maximum suppression. Keep in mind that x denotes the horizontal direction, hence columns of the image, and y denotes the vertical direction, hence rows, counting from the top-left of the image.
- scores is an nx1 vector that contains the R score for each detected keypoint.
- Ih,Iv are matrices with the same
number of rows and columns as your input image, and store the gradients
in the x (horizontal) and y (vertical) directions at each pixel. We'll use these outputs for the next assignment.
Instructions:
- [10 pts] Let's do some preprocessing. First, set some parameters at the beginning of your function: set the value of k (from the "Harris Detector: Algorithm" slide) to 0.05, and use a window size of 5. Second, convert the image to grayscale. Compute the horizontal image gradient Ih and the vertical image gradient Iv (use imfilter and Matlab will pad the image automatically around the border; make sure to convert the image to double before imfilter, which will be needed for later computations). Finally, initialize a matrix R of the same size as the image that will store the "cornerness" scores for each pixel.
- [15 pts] Use a double loop to compute the cornerness score R(i, j) at each pixel i, j. This score depends on a 2x2 matrix M computed for each pixel, as shown in the slides. This matrix relies on all neighbors of i, j that are less than half_window_size away from it. Thus, the matrix M for a given pixel is a summation of window_size^2 matrices, each of size 2x2. Each of the 2x2 entries is the product of gradient image values at a particular pixel. After computing M, use the formula from class to compute the R(i, j) score for that pixel. If a pixel does not have enough neighbors (i.e. pixels on the border of the image), set its R score to -Inf. You can directly call the det and trace functions.
- [5 pts] After computing all R(i, j) scores, it is time to threshold them in order to find which pixels correspond to keypoints. You can set the threshold for the "cornerness" score R however you like; for example, you can can simply output the top n keypoints or the top 1% highest-scoring keypoints.
- [10 pts] Perform non-maximum suppression by removing those keypoints whose R
score is not larger than all of their 8 neighbors; if a keypoint does not
have 8 neighbors, remove it. The scores/x/y that you output should correspond to the final set of keypoints, after non-max suppression. Tip: Don't remove indices while looping
over pixels; instead keep a vector of indices you want to remove,
then set the keypoint scores and coordinates at those indices to [].
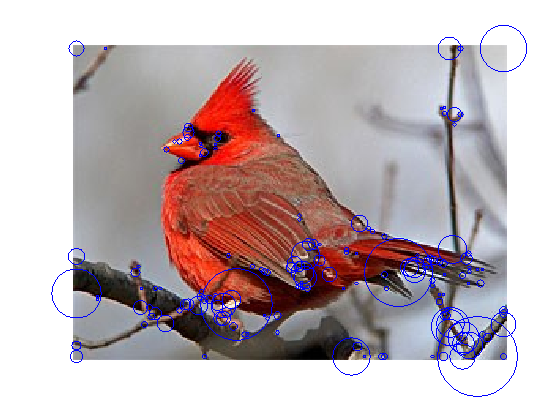
- [10 pts] Show your detected keypoints on three images. For each image, display the image and visualize the keypoints you have detected on it, for example by drawing a circle for each keypoint. Use the scores variable and make keypoints with higher scores correspond to larger circles, e.g. plot(x(i), y(i), 'ro', 'MarkerSize', scores(i) / 1000000000); (You don't have to divide by this value exactly.) Name your visualizations vis1.png, vis2.png, vis3.png. Here is a sample of keypoints that you might get on an image of a cardinal.
Submission:
- extract_keypoints.m
- vis1.png, vis2.png, vis3.png