CS1674: Homework 3
Due: 10/2/2018, 11:59pm
This assignment is worth 50 points.
In this problem, you will implement feature extraction using the Harris corner detector, as discussed in class. Use the following signature: function [x, y, scores, Ih, Iv] = extract_keypoints(image);
Input:
- image is a color image of class uint8 which you should convert to grayscale and double in your function.
Outputs:
- Each of x,y is an nx1 vector that denotes the x and y locations, respectively, of each of the n detected keypoints, i.e. points that (1) have "cornerness" R scores greater than a threshold, and (2) who survive the non-maximum suppression. Keep in mind that x denotes the horizontal direction, hence columns of the image, and y denotes the vertical direction, hence rows, counting from the top-left of the image.
- scores is an nx1 vector that contains the R score for each detected keypoint.
- Ih,Iv are matrices with the same
number of rows and columns as your input image, and store the gradients
in the x (horizontal) and y (vertical) directions at each pixel. We'll use these outputs for the next assignment.
Instructions:
- [10 pts] Let's do some preprocessing. First, set some parameters for use in your functions, at the beginning of your function: set the value of k (from the "Harris Detector: Algorithm" slide) to 0.05, and use a window size of 5. Second, read in the image, and convert it to grayscale. Compute the horizontal image gradient Ih and the vertical image gradient Iv. Finally, initialize a matrix R of the same size as the image that will store the "cornerness" scores for each pixel.
- [15 pts] Use a double loop to compute the cornerness score R(i, j) at each pixel i, j. This score depends on a 2x2 matrix M computed for each pixel, as shown in the slides. This matrix relies on all neighbors of i, j that are less than half_window_size away from it. Thus, the matrix M for a given pixel is a summation of window_size^2 matrices, each of size 2x2. Each of the 2x2 entries is the product of gradient image values at a particular pixel. After computing M, use the formula from class to compute the R(i, j) score for that pixel.
- [5 pts] After computing all R(i, j) scores, it is time to threshold them in order to find which pixels correspond to keypoints. You can set the threshold for the "cornerness" score R however you like; for example, you can set it to 5 times the average R score. Alternatively, you can simply output the top n keypoints (e.g. top 1%).
- [10 pts] Perform non-maximum suppression by removing those keypoints whose R
score is not larger than all of their 8 neighbors; if a keypoint does not
have 8 neighbors, remove it. The scores/x/y that you output should correspond to the final set of keypoints, after non-max suppression. Tip: Don't remove indices while looping
over pixels; instead keep a vector of indices you want to remove,
then set the keypoints at those indices to [].
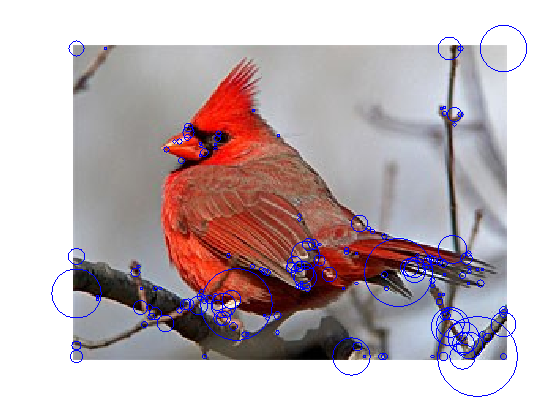
- [10 pts] Show your detected keypoints on three images. For each image, display the image and visualize the keypoints you have detected on it, for example by drawing a circle for each keypoint. Use the scores variable and make keypoints with higher scores correspond to larger circles, e.g. plot(x(i), y(i), 'ro', 'MarkerSize', scores(i) / 1000000000); (You don't have to divide by this value exactly.) Name your visualizations vis1.png, vis2.png, vis3.png. Here is a sample of keypoints that you might get on an image of a cardinal.
Submission:
- extract_keypoints.m
- vis1.png, vis2.png, vis3.png